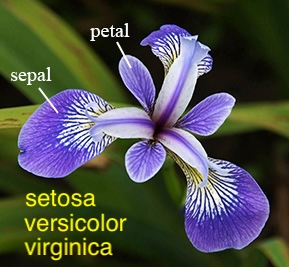
Iris Flower Classification
Description
The Iris Flower Classification Problem is a classic machine learning task to predict the species of an iris flower (Setosa, Versicolor, or Virginica) based on four features: sepal length, sepal width, petal length, and petal width. It serves as a foundational example for exploring classification techniques and model evaluation. By understanding this problem, learners can gain insights into how machine learning models are trained, tested, and deployed to make predictions.

Dataset
Below is the dataset used for the Iris Flower Classification task. The table provides details of the features (sepal length, sepal width, petal length, and petal width) along with the corresponding species of the iris flower. This dataset forms the foundation for model training and evaluation. You can scroll through the table to explore all the data.
| Sepal Length (cm) | Sepal Width (cm) | Petal Length (cm) | Petal Width (cm) | Species |
|---|
Visualize Data
Use the visualizations below to explore the dataset. Select a feature from the dropdown menu to see its distribution and trends. The line chart on the left shows the values of the selected feature for each sample, while the histogram on the right depicts the frequency distribution of the feature. These visualizations provide insights into the data patterns and variability.
Model
Configure the architecture of the neural network model for training. The number of units in a layer represents the number of neurons in that layer, which determines its capacity to learn patterns from data. Activation functions define how each neuron processes the input it receives.
Network Visualization
The following visualization represents the architecture of the neural network based on the selected configuration.
Model Training
In this section, configure the parameters to train the neural network. The train/test split ratio determines how much of the data is used for training versus testing the model. The learning rate controls how much the model adjusts during training. The number of epochs defines how many complete passes the model makes over the training dataset.
Model Evaluation
This section provides the evaluation metrics for the trained model. Accuracy represents the overall correctness of the model. F1-Score is a balance between precision and recall, making it a great indicator for imbalanced datasets. Precision shows how many of the predicted positive results are accurate, and recall indicates the sensitivity of the model to detecting true positives. The confusion matrix gives a detailed breakdown of the classification performance.
Accuracy: N/A
F1-Score: N/A
Precision: N/A
Recall (Sensitivity): N/A
Confusion Matrix
| Predicted Positive | Predicted Negative | |
|---|---|---|
| Actual Positive | True Positive (TP): N/A | False Negative (FN): N/A |
| Actual Negative | False Positive (FP): N/A | True Negative (TN): N/A |
Prediction
Use this section to predict the species of an Iris flower based on input features. You can select from predefined test data or manually enter values for Sepal and Petal dimensions. Click "Predict" to see the model's classification result and probabilities for each class.